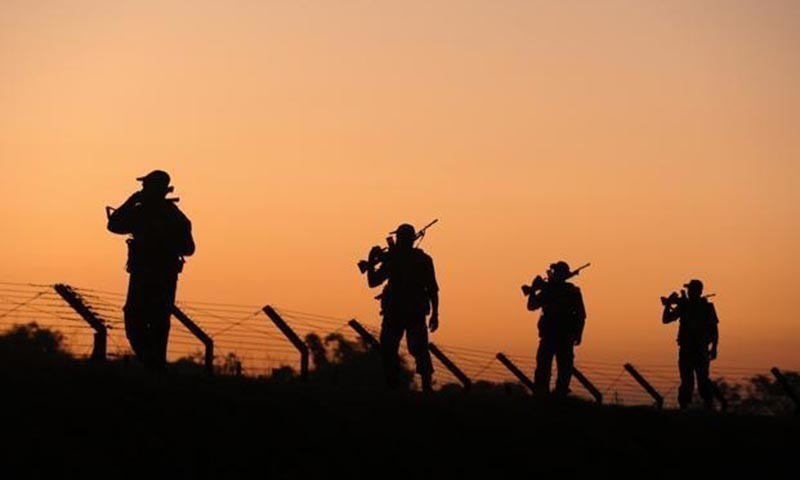
WASHINGTON: Between 2006 and 2016, armed forces personnel as a share of the labour force trended downward in every region except South Asia, says a US State Department report released on Thursday.
In 2006, South Asia had about 2.62 million personnel in the armed forces, which was 0.18 per cent of its total population and 0.43pc of its labour force.
In 2016, the total strength of armed forces in South Asia increased to 3.01 million, remaining at 0.18pc of the region’s population but increased slightly to 0.44pc of South Asia’s labour force.
The world’s annual value military expenditures, however, registered an increase of 19 to 38pc during this period, from about $1.74-$2.03 trillion in 2006 to about $1.73- $2.82 trillion in 2016, the report shows.
Thus, the global average of military expenditure for this 11-year period was between $1.67 and $2.48 trillion.
In South Asia, the lowest mean for the 11-year period was $53,100 million while the highest was $198,000 million. In 2016, South Asia spent up to $264,000 million on defence, including military personnel, services and hardware, which was up to 2.5pc of the region’s GDP.
South Asia’s lowest GDP to military expenditure percentage for the 2006-2016 period was 1.1pc and the highest was 2.5pc.
Among individual South Asian nations, Pakistan imported $07 billion worth of military goods and services in 2006, which increased to $1.4 billion in 2007 and 2008. In 2009, it increased further to $1.7 billion and reached a record high of $3.4 billion in 2010 but dropped to $2.0 billion in 2011.
In 2012, it went down to $1.5 billion, to $1.3 billion in 2013, and to $1.0 billion in 2014. In 2015, it was $1.2 billion and went further down to $0.9 billion in 2016.
During this 11-year period, Pakistan’s total imports of goods and services also continued to increase, from $35.1 billion in 2006 to $47.9 billion in 2008. It increased to $51.1 billion in 2014, dropped slightly to $48.6 billion in 2015 and increased to $51.6 billion in 2016.
Pakistan arms imports as percentage of all imports was 2.0pc in 2006, 3.8pc in 2007, 3.0pc in 2008. 4.8pc in 2009, 8.4pc in 2010,4.2pc in 2011, 3.0pc in 2012, 2.5pc in 2013, 1.9pc in 2014, 2.5pc in 2015 and 1.7pc in 2016.
In 2014, Pakistan exported $0.1 billion of military hardware. Since it was lower in other years, the data is not mentioned in the statistics released with the report.
In 2006, 2007 and 2008, Pakistan’s arms exports as percentage of all exports was 0.1pc. It was 0.0pc in 2009, 2010, 2011, 2012 and 2013. In 2014, it went up to 0.2pc of all experts but went back to 0.0pc in 2015 and 2016.
Pakistan’s arms balance as per cent of trade balance was 4.6pc in 2006, 9.1pc in 2007, 6.3pc in 2008, 13.0pc in 2009, 28.3pc in 2010, 12.5pc in 2011, 8.5pc in 2012, 6.5pc in 2013, 4.5pc in 2014 , 6.1pc in 2015 and 3.4pc in 2016.
Pakistan’s total experts, including goods and services, in 2006 was $20.5 billion, in 2007 it was $21.9, in 2008 it was $25.5 billion, in 2009 it was $22.3 billion, in 2010 it was $28.1 billion, in 2011 it was $31.4 billion, in 2012 it was $31.4 billion, in 2013 it was $30.0, in 2014 it was $30.6 billion, in 2015 it was $28.6 billion and it reached a new low of $26.8 billion in 2016.
During 2006-16, India’s arms exports were not very impressive either.